HW 2: Splay trees
Submission
Send the source code, the output on the generated testing data, and two graphs of the statistics (details below).
English program: deadline is November 20. Submit by e-mail to and a copy to my address on matfyz.cz.
Czech program: your deadline is November 13 and instead of the copy to me you submit to CodEx. Beware that CodEx assignments only accept some languages.
The problem to solve
Implement Splay trees. The standard input contains testing instructions, one operation per line. Each block starts with insertions (I key), then searches follow (F key), and the block ends with an R line which means the tree should be emptied. The whole file ends by an X line.
Output a pair for each block: the size of the testing set and the average depth of the searched keys. At the end of the output, add a more detailed statistics: how many times each depth occured during searches.
Example
Input
I 1
I 2
I 0
F 1
F 0
F 2
R
I 2
I 3
I 0
I 1
F 2
F 0
F 1
F 3
R
X
Possible output
3 1.3
4 1.5

2 1
1 2
0 1
Generating the input
Example: the command
/afs/ms/u/k/koucky/ds1/pbl2-gen-data XX Ngenerates the input for measurements, where XX is the last two digits from your personal number (UKČO) found in SIS. N is one of {0,10,100,1000,10000}, and it signifies how big a subset of the input is randomly searched (N=0 denotes all).
The block sizes start at a thousand elements and grow up to a million. There are 300 blocks. Example run:
pbl2-gen-data 72 0     | my-splay > data-0.out
pbl2-gen-data 72 10    | my-splay > data-10.out
pbl2-gen-data 72 100   | my-splay > data-100.out
pbl2-gen-data 72 1000  | my-splay > data-1000.out
pbl2-gen-data 72 10000 | my-splay > data-10000.out
Plotting the output
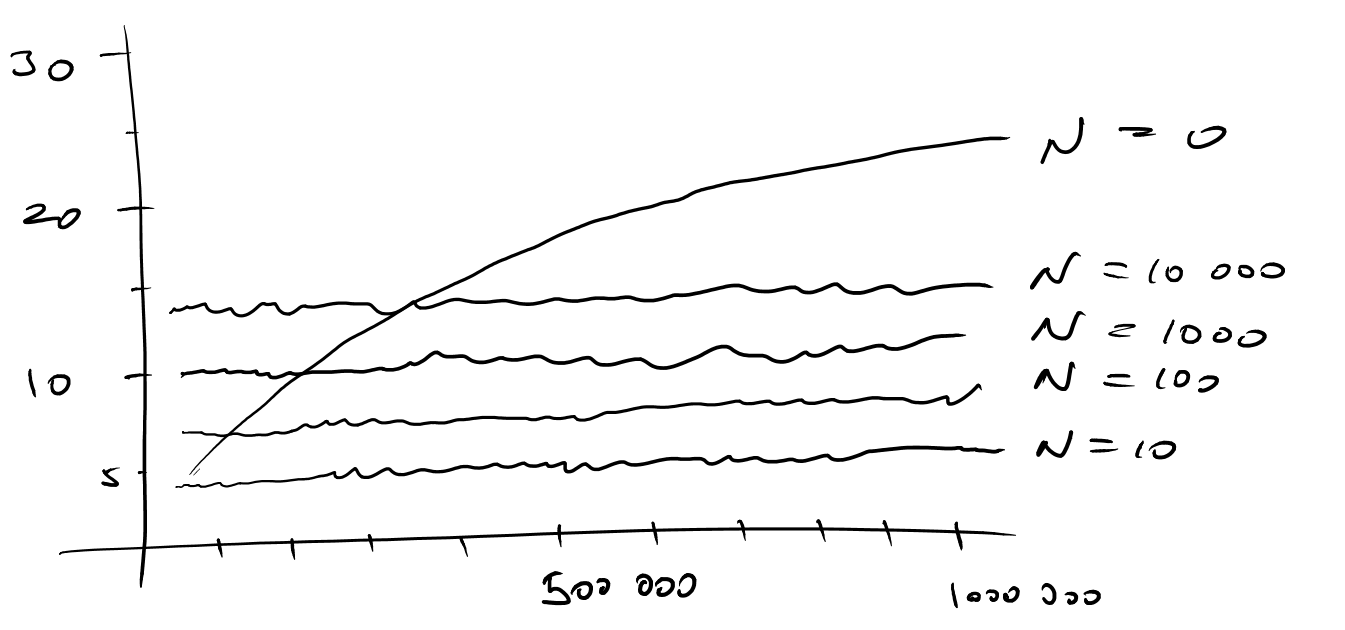
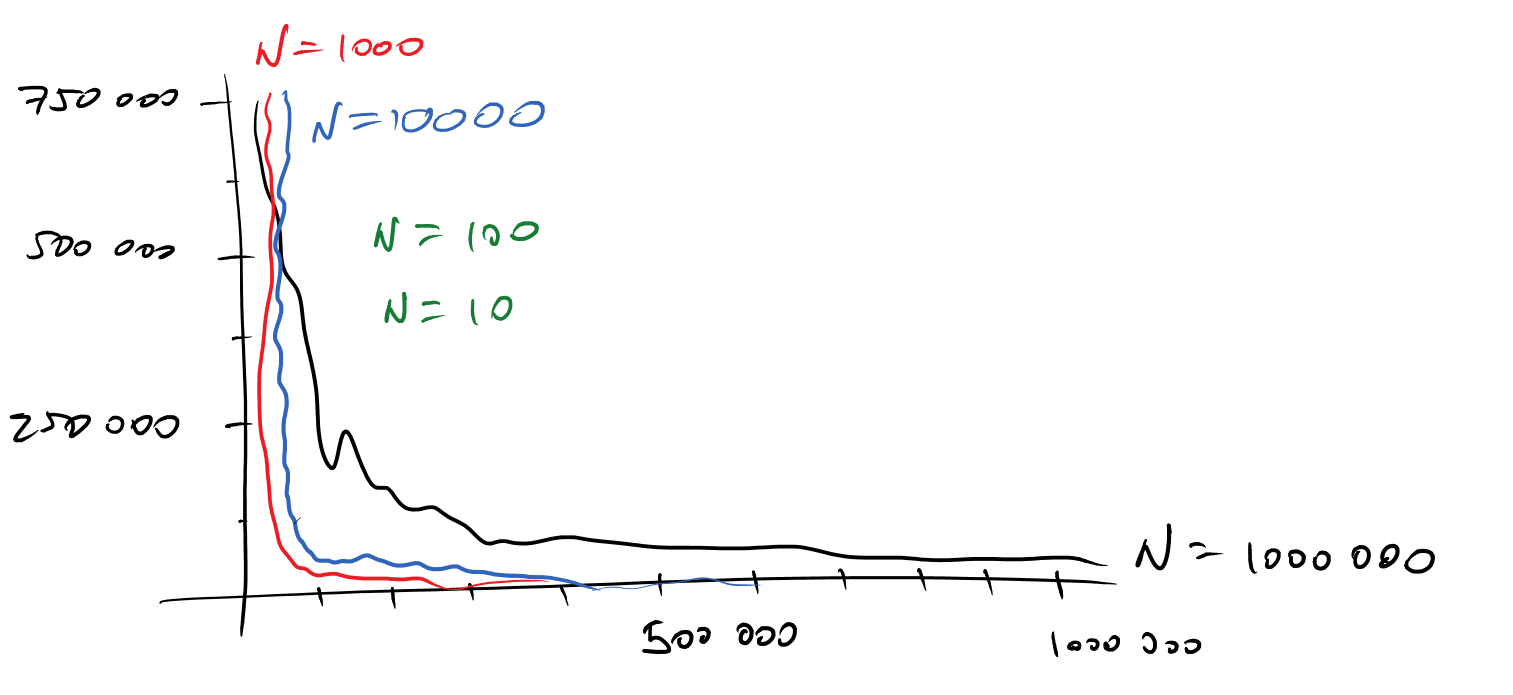
Create two graphs from the output, each containing one curve per N value. The first graph will come from the first parts of the outputs and show dependence of average searched depth (y-axis) on the size of the tree (x-axis). The second graph will come from the second parts of the ouptups and show the number of searches (y-axis) ending in a given depth (y-axis).